Country comparisons and factors contributing to their relative advantage or disadvantage in a global market
In the April 2022 report on world markets and trade of livestock and poultry, the United States Department of Agriculture’s Foreign Agricultural Service estimated that 11.7 million tons of pork will be exported in 20221. Pork producers around the world are competing in a global market. While that market can, and is, distorted by politics and trade relations, the global competitiveness of individual countries still matters.
How do producers in each country stack up regarding the profitability and cost of producing pork, and what factors contribute to their relative advantage or disadvantage in a global market?
Drs. Lee Schulz and Dermot Hayes in the Department of Economics at Iowa State University and I have collaborated to address this question each year since 2018.
The analysis of productivity, costs, and returns presented in this article are for 2020, the most recent available, using data primarily from InterPIG, an international benchmarking network.
The representatives of the seventeen participating countries in Europe, North America, and Brazil come from scientific institutions and extension services of producer organizations (Table 1). The InterPIG data is updated annually and represents a countrywide average performance of representative farms in each country. In addition to the information from InterPIG, data for Japan, China, Vietnam and South Korea, key pork-producing and importing countries in Asia, were obtained with the help of MSD Animal Health staff and consultants. The compiled data for the countries in Asia do not necessarily represent averages for all farms in each country. The data for Vietnam, South Korea, and Japan are for modern, commercial farms of various sizes that were free of African swine fever virus (ASFV). The data for China is for modern, large-scale, single-story, non-filtered farms that were free of ASFV.
Table 1. Cost of production and revenue for each country (US$ per kg of carcass weight), breed-to-market.
Great Britain – Agriculture and Horticulture Development Board (AHDB)
Austria – VLV Upper Austria
Belgium – Flemish Government and Boerenbond Belgie
Brazil* – Embrapa Swine and Poultry
Canada – Canadian Pork Council
Czech Republic – Institute of Agricultural Economics and Information (UZEI)
Denmark – SEGES
Finland – Atria
France – IFIP
Germany – Thuenen Institute and Interessengemeinschaft der Schweinehalter (ISN)
Hungary – AKI Research Institute ofAgricultural Economics
Ireland – Teagasc
Italy – Research Centre for Animal Production (CRPA)
Netherlands – Wageningen Economic Research
Spain – SIP Consultors
Sweden – Svenska Pig
USA – Iowa State University
*Brazil has two data points because of the significant differences that exist between the traditional hog farming areas of Santa Catarina(SC) and the new frontier in Brazilian pork production, Mato Grosso(MT)
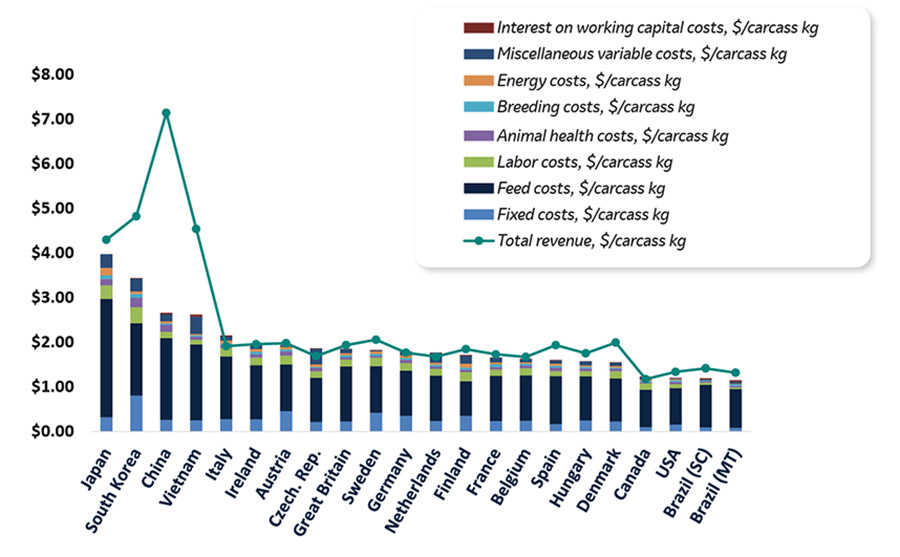
In 2020, the estimated cost of production from breed-to-market ranged from US$3.97 per kg of carcass weight sold in Japan to US$1.15 per kg of carcass weight sold in the state of Mato Grosso of Brazil, a difference of US$2.82 between the highest and lowest cost countries (Figure 1, bars).
The line in Figure 1 represents the market pig price or revenue per kg carcass weight basis. The difference between the top of each stacked bar (total cost) and the line (revenue) represents the profit in each country.
Figure 1. Cost of production and revenue for each country (US$ per kg of carcass weight), breed-to-market. 2020.

The dominant story in 2019 was China’s high market pig prices in response to lower pork supply driven by African swine fever virus (ASFV). Chinese market pig prices were up 69% year-over-year in 2020 compared to 2019 resulting in a remarkable period of profitability for producers in the country despite the problems caused by ASFV.
What are the major factors that give each country a competitive advantage or disadvantage?
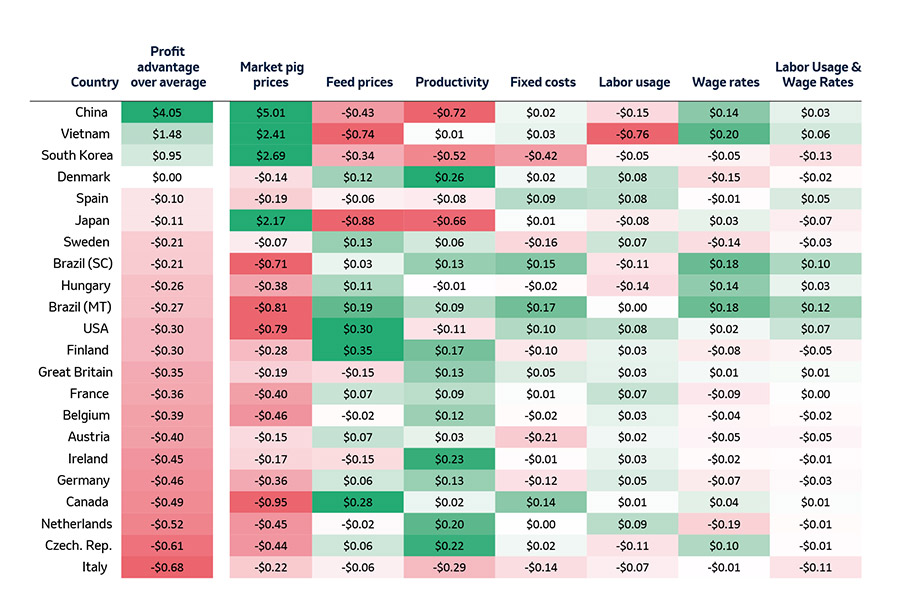
Not surprisingly, the data shows that market pig prices and feed prices are the factors that contribute the most to the relative advantage or disadvantage in profitability for producers in each country.
The next most significant factor is productivity. The productivity measures were the only value(s) that varied for each country. Any differences in profitability, therefore, were due strictly to the country’s differences in productivity.
The relative advantage or disadvantage in profitability attributed to productivity for each country is shown in Table 2.
- The most productive producers are in Europe, except for Spain and Italy. Producers in Europe produce the most pork per breeding female per year. Producing more pork per breeding female spreads the fixed costs of production (buildings, equipment, breeding females etc.) over more pork, thus improving itability.
- Producers in Asia are the least productive. However, producers in Vietnam use large amounts of labor and achieve a relatively high whole herd feed conversion, which contributes to the relative advantage in profitability attributed to productivity there compared to other countries in Asia.
Table 2. Profit advantage of select factors, all other variables held constant, US$ per carcass kg sold basis, 2020

Conclusions
- If we compare pork producers based on profitability, as we do when we evaluate companies, then China and Vietnam come out on top.
- If we use animal husbandry and productivity as a performance measure, then Denmark and the Netherlands rank at the top.
- If we use production costs as a metric, the USA and Brazil are the most competitive.
References
1. United States Department of Agriculture (USDA), Foreign Agricultural Service (FAS). Livestock and Poultry: World Markets and Trade. April 8, 2022.

