Country comparisons and factors contributing to their relative advantage or disadvantage in a global market
This is the fourth in a series of reports from the Global Swine Benchmarking project that benchmarks international pork production. The first report was based on 2018 data and this report updates the comparison to data for 2021. These reports have also spanned the COVID-19 pandemic and the 2021 outbreak of ASFV in domestic herds in Germany.
How do producers in each country stack up regarding the profitability and cost of producing pork, and what factors contribute to their relative advantage or disadvantage in a global market?
Drs. Lee Schulz and Dermot Hayes in the Department of Economics at Iowa State University and I have collaborated to address this question each year since 2018.
The analysis of productivity, costs, and returns presented in this article are for 2021, the most recent available, using data primarily from InterPIG, an international benchmarking network.
The raw data comes primarily from an international benchmarking network known as InterPIG. The representatives of the eighteen participating countries. Brazil has two data points because of the vast differences between the traditional pig farming state of Santa Catarina (SC) and the new frontier in Brazilian pork production, Mato Grosso (MT). Santa Catarina is free of foot and mouth disease virus (FMDV) and is eligible to export to a wide range of countries. In 2021, Mato Grosso was not free of FMDV and could only export to a very limited list of importers. During the COVID-19 pandemic in 2020, the Brazilian currency (Real) fell by about 25% and it has not recovered. Consequently, Brazilian prices expressed in U.S. dollars are lower than they would have been had the value of the Real not fallen relative to the U.S. dollar. Representative data for China, Japan, South Korea, and Vietnam, was obtained with help from industry consultants in each country and MSD Animal Health (Merck Animal Health in the United States and Canada) technical, marketing, and sales staff. The intention is to add additional countries in future years.
The dominant story between 2021 compared to 2020 was that most countries except the EE.UU. and Canada, experienced lower market prices, higher stable costs and lower profitability.
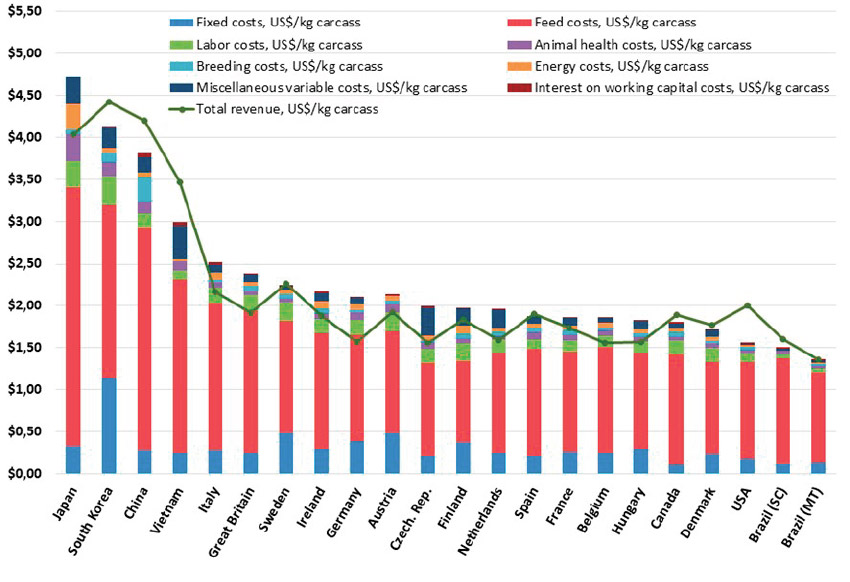
The line in Figure 1 represents the market pig price or revenue per kg carcass weight basis. The difference between the top of each stacked bar (total cost) and the line (revenue) represents the profit in each country.
Figure 1. Cost of production and revenue for each country (US$ per kg of carcass weight), breed-to-market.2021

The simple averages of the market pig price and profitability for all countries fell by US$0.17 and US$0.54 per kg of carcass weight, respectively. Total cost and feed prices increased by US$0.36 and US$0.29, per kg of carcass weight, respectively, in 2021 compared to 2020.
Unfortunately for German producers, an increase in productivity had a negative impact because it meant more pigs were fed to market weight with variable costs that exceeded market prices. Germany discovered ASFV in a domestic herd in July 2021 and the resulting export market closures impacted domestic market pig prices.
What are the major factors that give each country a competitive advantage or disadvantage?
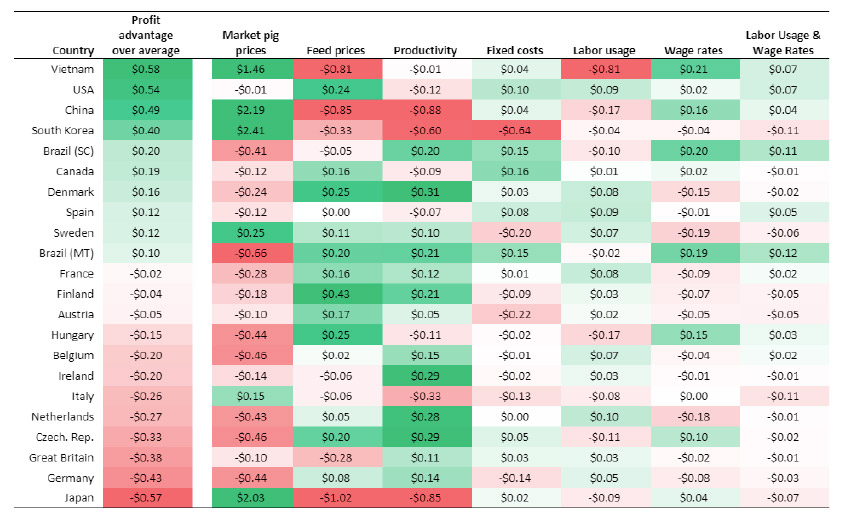
As in previous years, the factors that contributed to the highest relative advantage or disadvantage were market pig prices, feed prices, and productivity.
The relative advantage or disadvantage for the other factors evaluated, wage rates, labor productivity, and fixed costs were lower but still important.
The relative advantage or disadvantage in profitability attributed to productivity for each country is shown in Table 1.
- The most productive producers are in Europe, led by Denmark, except for Spain and Italy. Producers in Europe produce the most pork per breeding female per year. Producing more pork per breeding female spreads the fixed cost of production (buildings, equipment, breeding females etc.) over more pork, thus improving profitability.
- Producers in Asia are the least productive. However, producers in Vietnam fared well on this measure because their very high labor usage.
Table 1. Profit advantage of select factors, all other variables held constant, US$ per carcass kg sold basis, 2021.

Conclusions
- If we compare pork producers based on profitability, as we do when we evaluate companies, then Vietnam, China, South Korea and USA come out on top in 2021.
- If we use animal husbandry and productivity as a performance measure, then Denmark and the Netherlands rank at the top.
- If we use production cost as a metric, Brazil is the most competitive in 2021.
References
1. United States Department of Agriculture (USDA), Foreign Agricultural Service (FAS). Livestock and Poultry: World Markets and Trade. April 2023.

